24h Colocated Benchmark of Solana Pump.fun WebSocket Feeds
Every platform claims to be the fastest. We ran three of them head-to-head for 24 hours straight, colocated physical servers synchronized by NTP and recorded exactly when each one saw the new token. 82,056 total events with 27,369 unique mints. Full dataset is public.
If speed is claimed, it should be proven.
Results at a Glance
Across 27,369 token mints:
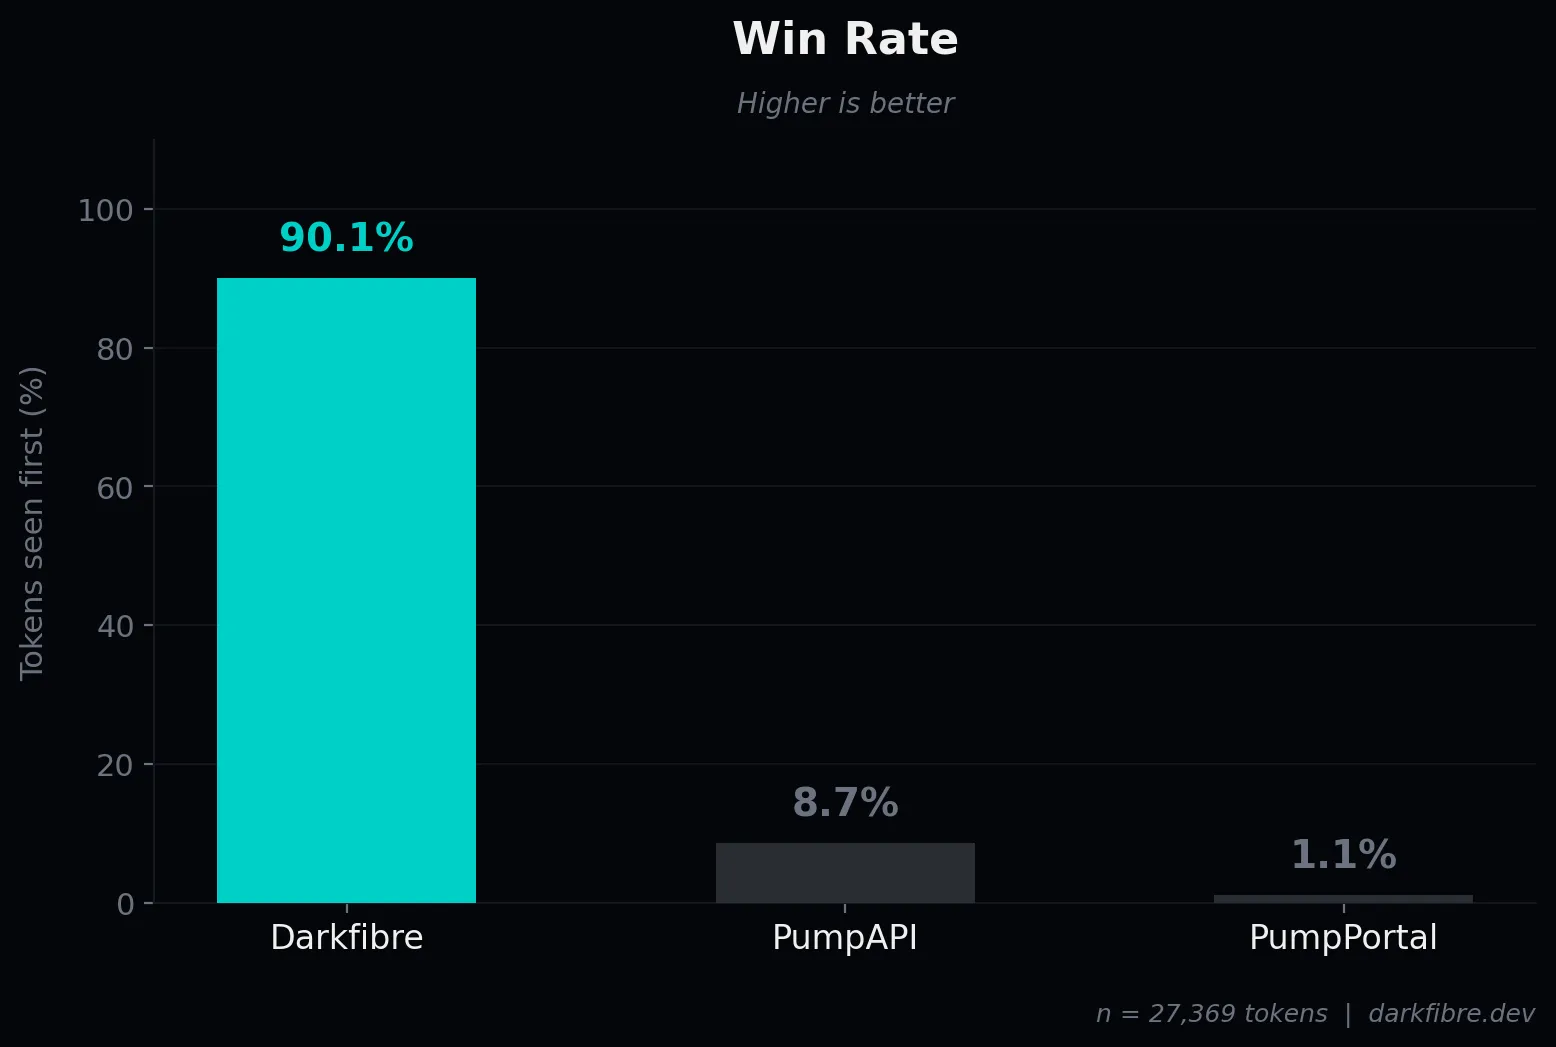
- Darkfibre was first in 90.1% of cases
- PumpAPI: 8.7%
- PumpPortal: 1.1%
Latency across all events:
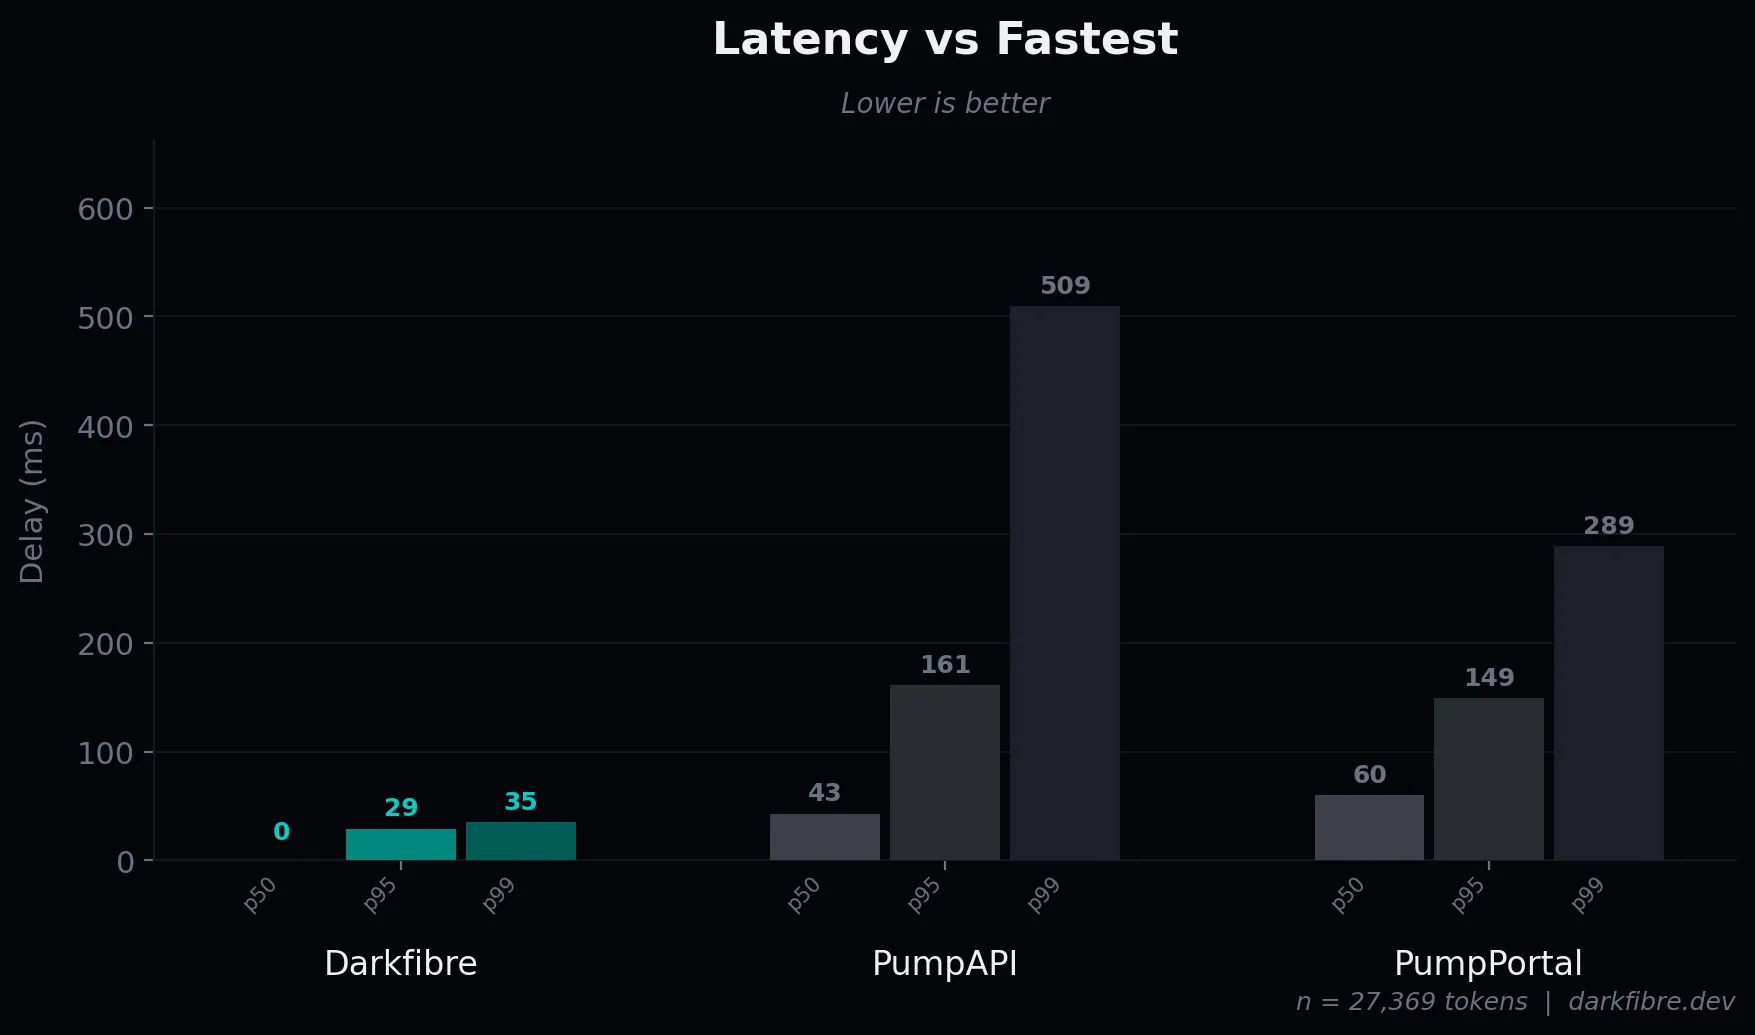
- Darkfibre: average 2.7ms, p99 35ms
- PumpAPI: average 63.8ms, p99 509ms
- PumpPortal: average 70.3ms, p99 289ms
Why This Matters
All trading events like token launches, liquidity shifts or large trades are observed by many competing systems simultaneously. Bots, snipers and manual traders are all waiting for the same signal. The market only rewards the first movers; value degrades rapidly as more participants respond to the same event.
Feed latency determines when a system becomes aware of the event. All subsequent processing: transaction construction, signing and broadcast is blocked until that point.
How We Measured It
Two physical servers were used:
- New York — connected to PumpAPI and PumpPortal
- Frankfurt — Darkfibre primary region
This reflects realistic production deployment rather than a same-machine comparison.
Clocks were synchronized via NTP. For each new token mint we recorded the mint address, platform, server location and WebSocket receive timestamp.
The earliest timestamp across all platforms defines the reference point for each mint. All other observations are measured relative to it. A platform that arrives first has a delay of zero by definition; no absolute clock reference is used.
Results
27,369 unique token mints over 24 hours and 82,056 total platform observations.
Win Rate
The primary metric is simple: which platform saw the event first.
| Platform | Win Rate | Wins |
|---|---|---|
| Darkfibre | 90.1% | 24,658 |
| PumpAPI | 8.7% | 2,369 |
| PumpPortal | 1.1% | 309 |
Ties were statistically insignificant (~0.1% of mints).
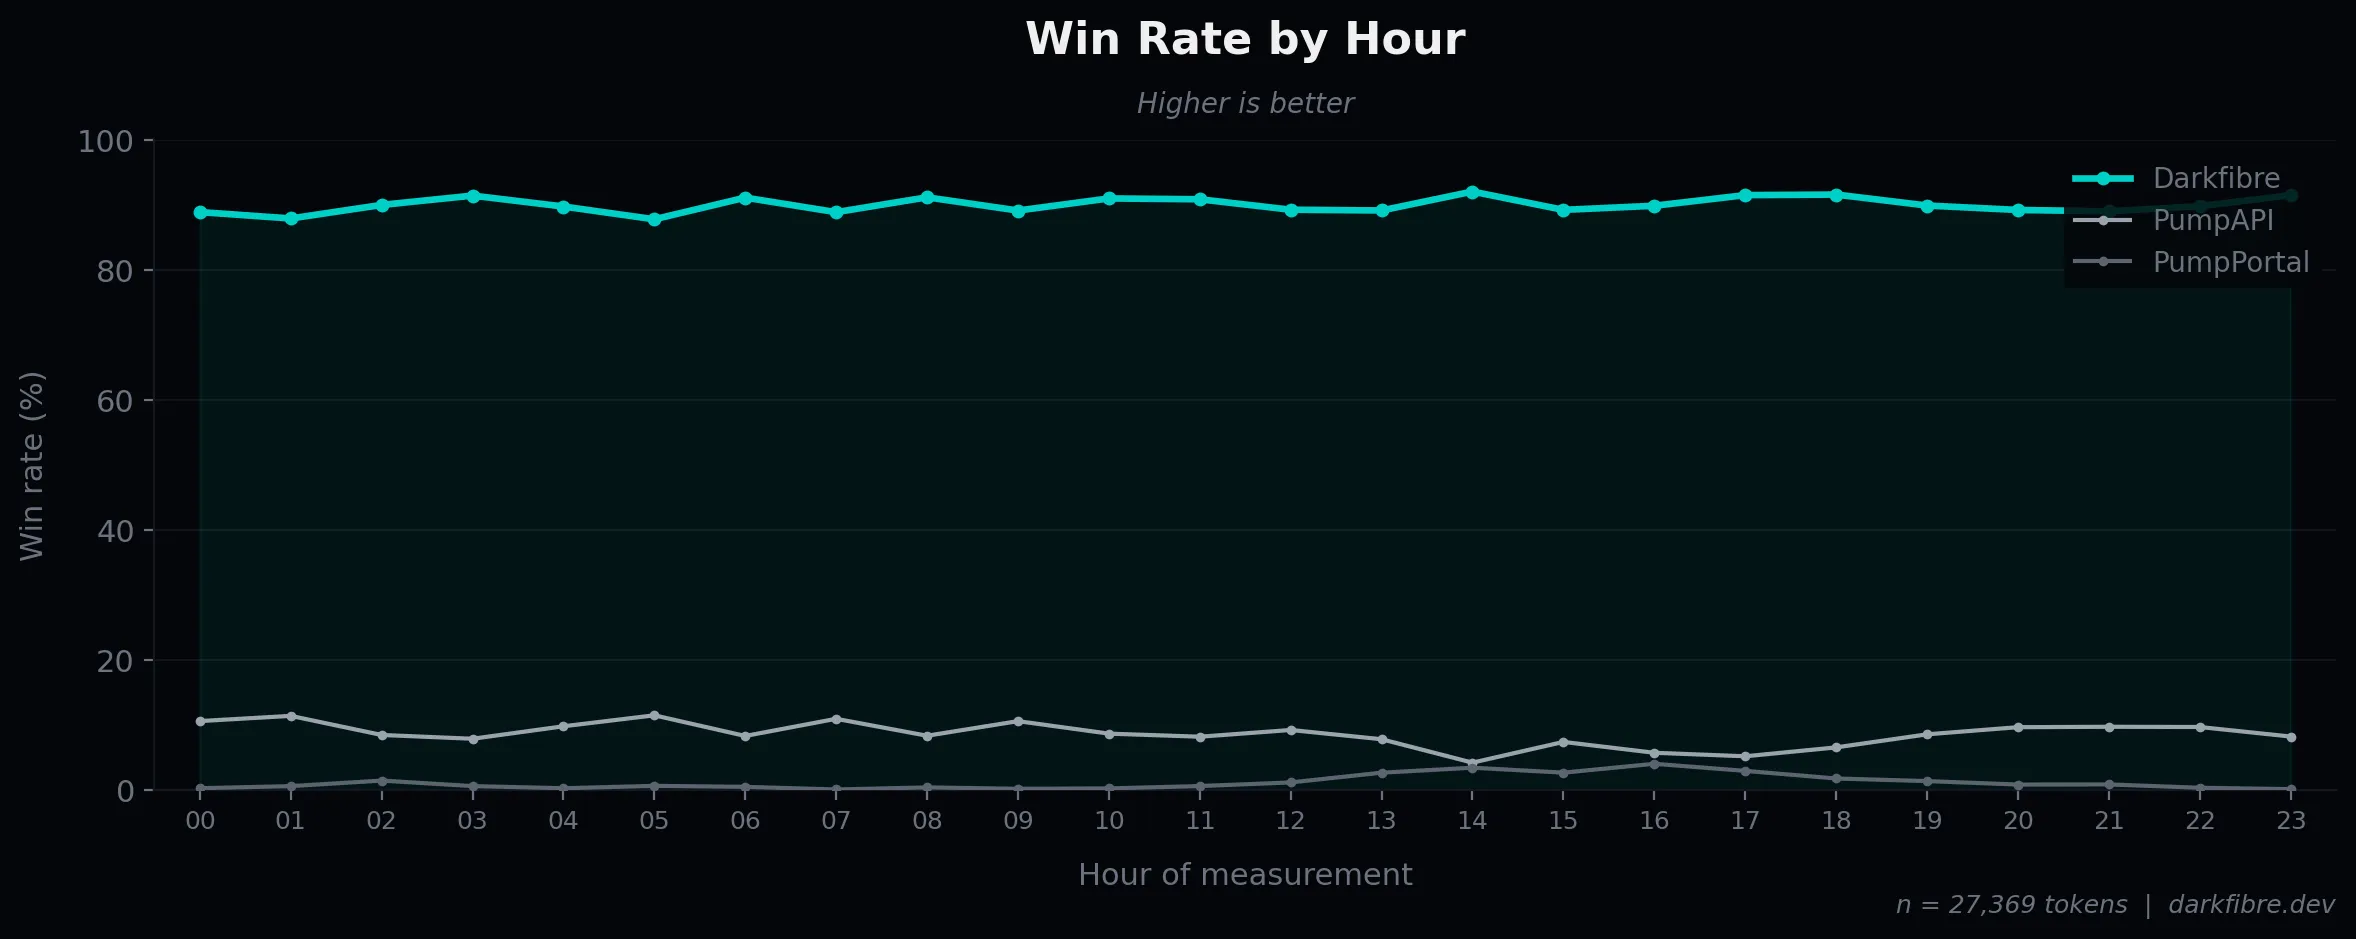
In the majority of launches during the 24-hour window, Darkfibre was the earliest observer of the mint event.
Latency
Latency is measured as the relative delay between a platform and the fastest observed platform for each token creation event. A platform that arrives first has a delay of zero by definition. The table below covers all 27,369 mints - wins are included as 0 ms.
| Platform | Mean | p50 | p95 | p99 |
|---|---|---|---|---|
| Darkfibre | 2.7 ms | 0 ms | 29 ms | 35 ms |
| PumpAPI | 63.8 ms | 43 ms | 161 ms | 509 ms |
| PumpPortal | 70.3 ms | 60 ms | 149 ms | 289 ms |
Darkfibre’s median delay is 0 ms because it wins the majority of events outright. The mean of 2.7 ms reflects the small fraction of cases where it does not arrive first. PumpAPI and PumpPortal trail by 43–60 ms at the median with heavy tails extending past 500 ms at p99.
Coverage
There were 27,369 unique mints observed across all three feeds. No single platform caught all of them. Coverage below is each platform’s count against that total.
| Platform | Mints Observed | Coverage |
|---|---|---|
| Darkfibre | 27,365 | 99.985% |
| PumpAPI | 27,364 | 99.982% |
| PumpPortal | 27,313 | 99.795% |
Darkfibre missed 4 tokens, PumpAPI missed 5 tokens and PumpPortal missed 56 tokens.
All three feeds caught nearly everything. The gap was in timing, not coverage.
Interpretation
We chose pump.fun create token events as a baseline because they provide a clean deterministic trigger. A new mint immediately opens a fresh bonding curve.
The pricing model explicitly rewards earlier buyers, which naturally incentivizes aggressive early participation. As a result a large number of bots and execution systems monitor mint creation and attempt to act as soon as possible.
Whether a system constructs transactions locally or delegates execution to an upstream API, it cannot act before the mint event is observed.
Propagation timing therefore defines the earliest possible reaction point.
Internal logic may execute in microseconds. Transaction builders may be highly optimized. Priority fees may be tuned precisely. None of those layers activate before event visibility.
The dataset shows that under colocated conditions:
- Observation timing differs materially
- Tail latency diverges sharply when a platform loses the race
- All platforms observe nearly all mints
Transparency & Replication
This benchmark is fully reproducible and the following are publicly available:
- Raw dataset (all recorded mint observations and timestamps)
- Capture service implementation
- Analysis scripts used to compute win rate and delay distributions
- Infrastructure configuration details
- Step-by-step replication guide
Clock synchronization was maintained via NTP during the measurement window.
Anyone can deploy equivalent infrastructure in comparable regions and rerun the benchmark under the same methodology.
The full repository: raw dataset, capture service, analysis scripts and replication guide is available at:
github.com/darkfibre-dev/pump-latency-benchmark.
Conclusion
In a market where every platform claims to be the fastest, very few publish measurable data under controlled conditions.
This study ran continuously for 24 hours, covering 27,369 pump.fun token mints under colocated deployment. Under those conditions Darkfibre observed the majority (90.1%) of mint events first. PumpAPI lagged behind with an average delay of 63.8 ms (p99: 509 ms) and PumpPortal averaged a delay of 70.3 ms (p99: 289 ms).
For systems competing to react to market events, whether token mints, trades, liquidity shifts or strategy-specific signals, event visibility defines the earliest possible start of execution. That boundary exists before transaction construction, fee selection or blockchain broadcast.
This document establishes that this boundary is measurable and not uniform across platforms.
The dataset, capture code and analysis are public. If speed is claimed, it should be proven.
Next Step
This study isolates the visibility boundary preceding execution. It does not model full transaction lifecycle or realized fills.
The next phase of this research will extend the measurement to end-to-end systems. Event detection through transaction building and blockchain broadcast. This will benchmark complete token sniping paths under comparable priority fee conditions.
Event propagation is the first boundary. Full execution measurement is the next.